
Creating timeline charts in Office Timeline using Jira data
About the product
Office Timeline is a timeline and GANTT chart maker that allows management and operations professionals visualize project progress. Office Timeline includes both an Add-in for Microsoft PowerPoint and a Web version, which is available for all types of OS.
Both the Microsoft PowerPoint Add-in, as well as the Web app, provide users multiple ways to enter and edit data in order to easily create customizable project timelines. One of the ways in which users can bring in their data is by importing it from Microsoft Excel, Microsoft Project, Smartsheet, and now, from Jira.
Project goal
The import feature should enable users to seamlessly integrate their Jira project data into Office Timeline, streamlining the process of creating visually compelling project timelines. This integration empowers users to work more efficiently by leveraging existing data without manual entry.


Project overview
Team & my role
The implementation team that worked on this project included developers and testers, who work in the Agile methodology, along with a Scrum master and a product owner.
As the UX Designer on the project, my role included the following tasks:
Secondary research on Jira environment and market opportunities for growth, as well as:
Explore types of data stored in Jira, data structure and access matrices
Explore Jira design system and ways to integrate and combine components
Primary research (user interviews with Jira users & OTL users)
Identify Jira users data visualization needs
Scope OTL users’ Jira use
Wireframing, prototyping & usability testing
Final design proposal & assistance during implementation.
Design should allow users to:
Select Jira board or project to bring into OTL
Apply filters to allow data manipulation
Map Jira data properties to columns in Office Timeline
Select project data to transform into timeline tasks, milestones and swimlanes
Generate customizable timeline.
Project timeline
Expected impact
Key Functionalities:
Data Source Integration: Users should securely connect their Jira accounts to Office Timeline and access relevant projects.
Project Selection: After authentication, users should be able to browse and select specific Jira projects and issues they want to visualize.
Data Mapping: A guided interface should allow users to map Jira fields (e.g., issue type, start/end dates, assignees, status) to timeline elements such as tasks, milestones, and swimlanes.
Advanced Filtering: Users should be able to apply filters based on status, assignee, issue type, priority, or custom fields to refine the data that appears on the timeline.
Timeline Generation: Once data is imported and configured, users should be able to instantly generate a timeline with customizable styles, ready for presentation or export.
Business goals and expected benefits:
Increase revenue by attracting a new user segment - Jira users
Increase conversion to Expert plan (access to Jira import)
Increase retention for corporate accounts by enabling teams to maintain up-to-date project visuals synced with their Jira workflows
Improve user adoption of data imports
Reduce redundant manual data entry, errors and enhance data consistency
Save time by automating the transformation of Jira data into visual timelines.

Data-driven insights
Research objective phase I: Explore users’ Jira data setup and data visualization needs
Sample demographics
9 OTL users (5 male, 4 female);
7 Jira users (3 male, 4 female);
Job titles: Product manager, BA Consultant, Senior Product manager, Project manager, Senior Strategy Analyst, Senior BA
Methodology
User interviews were scheduled via Calendly & Outlook
OTL Users were recruited via Intercom
External recruitment was handled via userinterviews.com.
Research objective phase II: Validate approach for switching between Jira sites, multiple accounts and projects
Sample demographics
133 respondents, Jira & OTL users
Methodology
Survey implemented in Typeform that addressed key questions such as:
How many Jira accounts do you have?
How many organizations are you part of, in Jira?
Which Jira template(s) does your company use?
Approximately, how many projects/boards do you manage/have access to, in Jira?
Which of the following Jira types of items have a start date and end date that you could track on a timeline?

Research results Phase I:

Design iterations
Initial wireframes

First low-fi explorations focused on identifying to main steps of the user flow and translating the high level requirements into UI proposals, keeping in mind the existing import UI, the Microsoft design system and scalability.

V1
V2
Review & feedback
The initial explorations went through a few rounds of feedback with Product and dev team, and internal usability testing sessions with colleagues from other departments.
Internal usability testing sessions were conducted to evaluate and refine the Jira data import experience in Office Timeline. The sessions focused on three core areas:
Changing Jira Sites
Managing Jira Accounts
Selecting a Primary Data Source (Project or Board)
Mapping data
Key Findings & Feedback
1. Changing Jira Sites/Organizations:
Feedback: Dev team found there are technical constraints on having users change the Jira side on the same page as loading boards and projects for each organization to switch between Jira sites, especially when multiple sites were connected.
Suggestions:
Break down selection of Jira site and project or board on two different pages.
2. Managing Jira Accounts:
Feedback: Participants were sometimes confused about which Jira account was active or how to switch accounts.
Suggestions:
Offer better account-switching UI, with user avatars or email addresses for recognition.
Clearly indicate if authentication or reauthorization is required when changing accounts.
3. Selecting a Primary Data Source (Project or Board):
Feedback: Selection is clear, but there was discussion regarding the default selection, whether a project or board should be the primary entry point.
Preferences:
Some participants mentioned that starting from a project should be the default selection.
Others favored boards, especially when dealing with larger organizational planning.
Suggestions:
Further exploration regarding preference for projects or boards for Jira users.
Allow switching between project and board after initial selection, if feasible.
Include filters from Jira in this step.
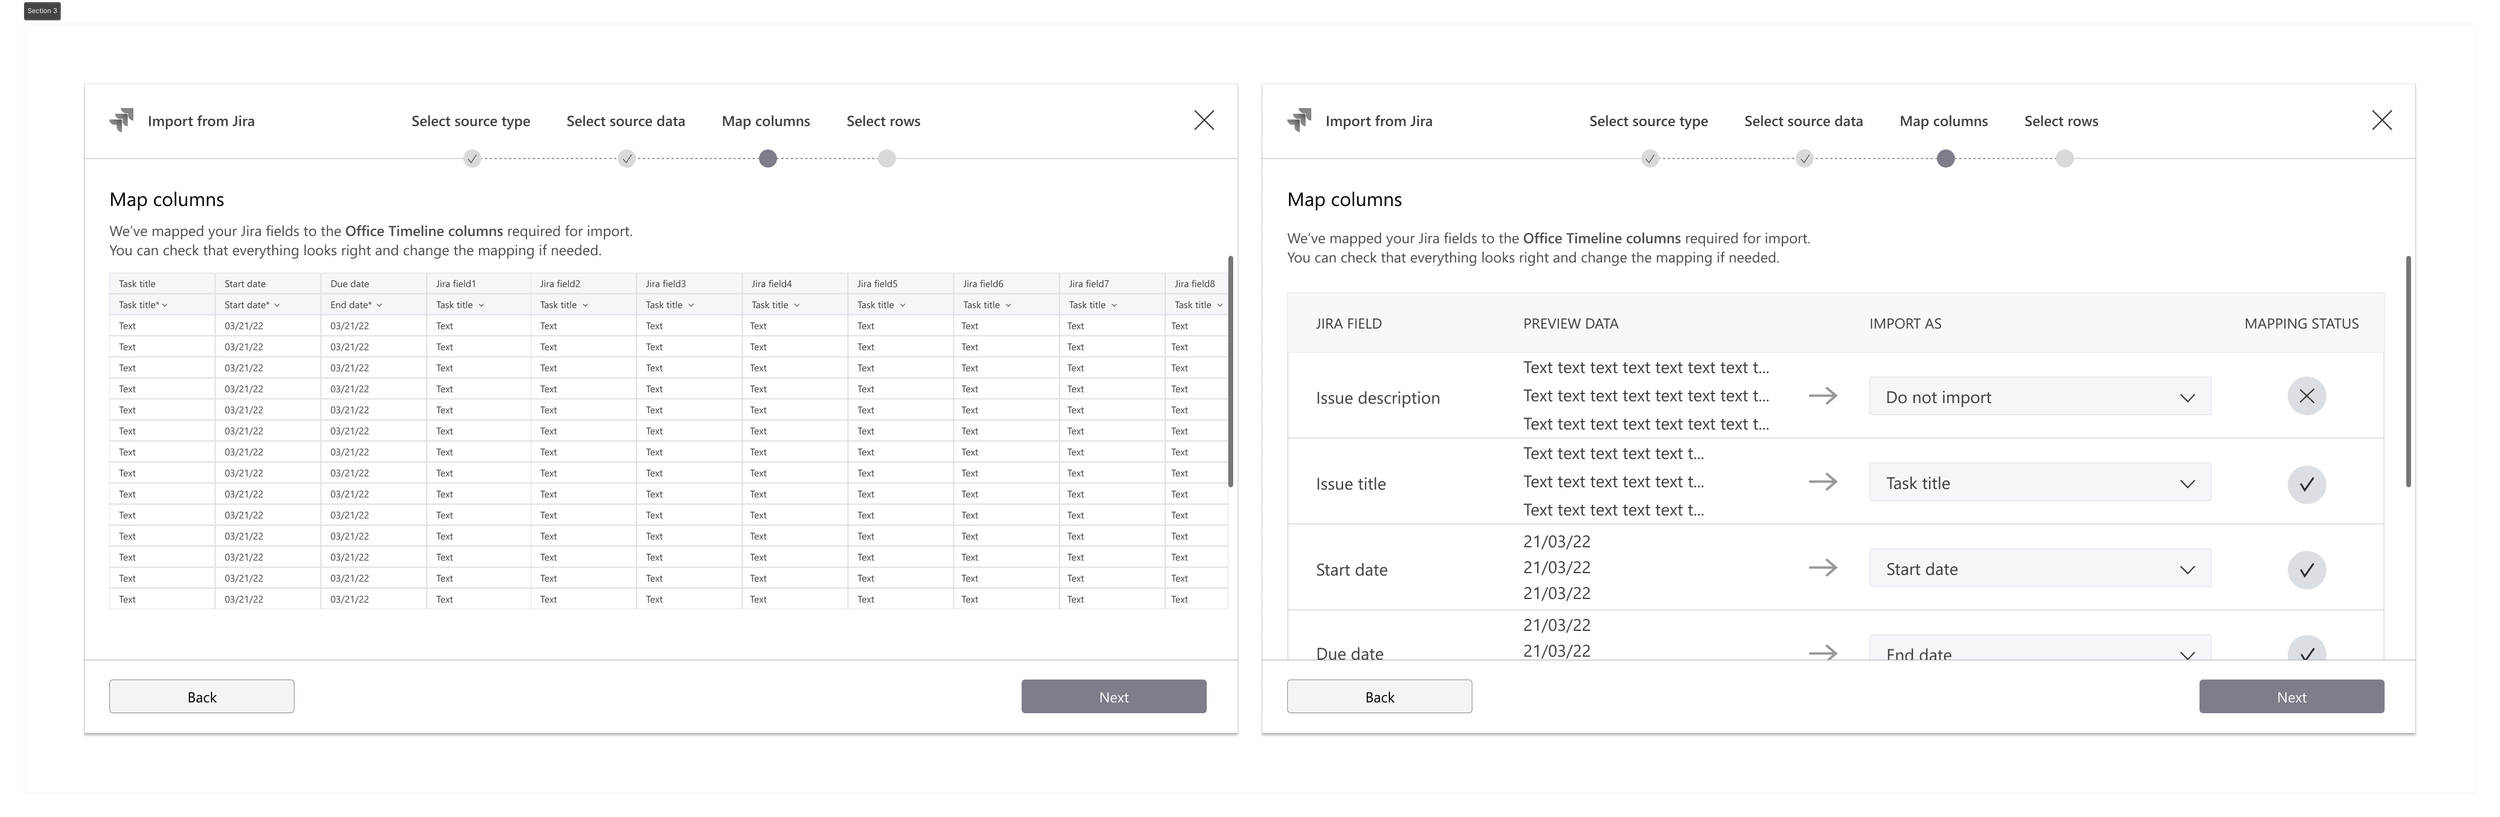
4. Mapping data
Feedback: The current UI for imports allows users to view an extensive preview of their data and changing the design pattern may be problematic.
Preferences:
Some participants mentioned that PMs using Microsoft are accustomed to working with large data tables (V1).
Familiarity with large data tables was discussed and most participants found it easier to scan data in V1.
Suggestions:
Review compatibility of current design pattern for Jira datasets.
Next Steps:
Separate selections for Jira site/organization and for improved discoverability of site/account context.
Explore guidance for users when selecting projects or boards, default selections.
Explore defaulting to the last used or most relevant board/project to reduce friction.
Keep current design pattern for mapping data.

UX refinement


Key Improvements
1. Streamlined Site and Account Management
Clearer Context Visibility:
The currently selected Jira site and account are now displayed prominently at the top of the import flow, reducing confusion and reinforcing user orientation.Improved Switching Flow:
Users can easily switch Jira sites or accounts through a redesigned dropdown menu with user-friendly labels, aligning with Microsoft’s preference for contextual actions over modal interruptions.Persistent Session Memory:
The system now remembers the last used site and account, helping frequent users resume work quickly without redundant setup steps.
2. Enhanced Project/Board Selection Logic
Primary Data Source Selection Simplified:
Users now select either a Project or Board as their starting point via a dedicated step with side-by-side comparison cards, with Project being the default selection.Dynamic Filtering and Search:
For scalability, especially with large enterprise accounts, the selection interface includes:Incremental search with real-time results
Scoped search (e.g., only show boards from a specific site)
Filters created in Jira
Mapping Refinements:
Improved mapping logic ensures consistent handling of:Epics, sprints, and issue hierarchies
Custom field support for dates and task status - these improvements align with Microsoft standards for handling complex data sets in tools like Project and Excel.
Design Principles Followed
Consistency: UI elements follow Office Timeline and Microsoft Fluent design system standards.
Clarity: Decision points are more self-explanatory, reducing user hesitation.
Efficiency: Optimizations favor high-frequency users and enterprise-scale datasets.
Impact
User goals
1. Select Jira Board or Project to Bring into Office Timeline
Outcome:
The redesigned selection step allows users to choose between a Project or Board with clarity and confidence.How it's achieved:
Side-by-side cards explain each option’s scope.
Search and filtering support rapid access.
2. Apply Filters to Allow Data Manipulation
Outcome:
Users can now easily narrow down imported data to what’s relevant, improving focus and reducing noise.How it's achieved:
Pre-defined filters (e.g., issue type, status, assignee, sprint) can be applied during the import step.
Filtering respects user roles—surfacing only permitted data sets per Jira permissions.
3. Map Jira Data Properties to Columns in Office Timeline
Outcome:
Mapping is now more intuitive and adaptable, ensuring accurate data alignment between Jira and Office Timeline.How it's achieved:
Auto-detection of common Jira fields (summary, due date, status).
Manual override available via dropdown mapping interface for full control.
Support for custom fields improves flexibility for complex or non-standard Jira setups.
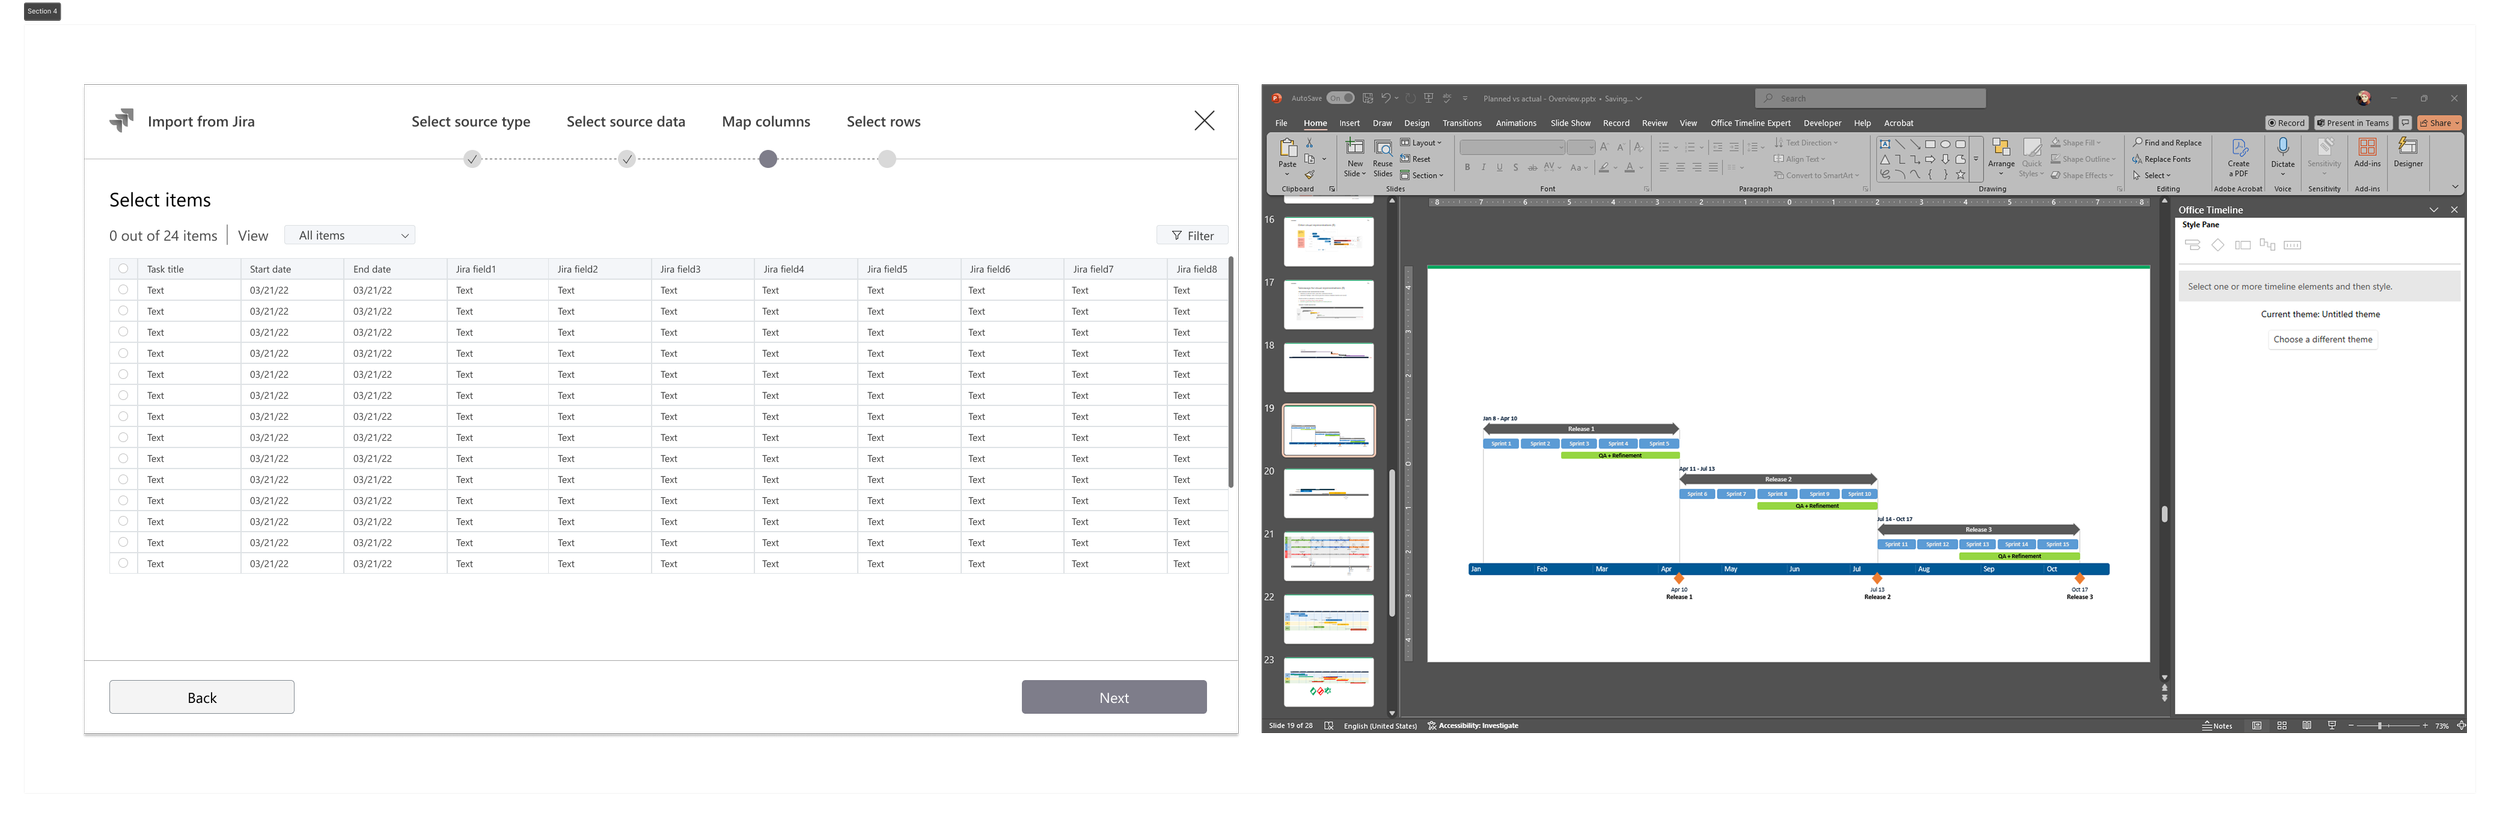
4. Select Project Data to Transform into Timeline Tasks, Milestones, and Swimlanes
Outcome:
Users can select which issues convert into visual timeline elements with minimal friction.How it's achieved:
Clear UI for selecting items/rows that convert to Tasks, Milestones, or Swimlanes based on type or field values.
Multi-select support enables bulk actions for faster workflows.
Preview shows how the selection will render before finalizing.
5. Generate Customizable Timeline
Outcome:
The timeline generation process reflects the user’s mapping and filters, while supporting full customization.How it's achieved:
Imported items appear in editable format within the timeline canvas.
Users can adjust colors, labels, dates, groupings, and layout post-import.
Timeline templates and styles integrate smoothly with the rest of the Office Timeline experience.
Business goals
1. Attract a New User Segment – Jira Users
Outcome:
A simplified, guided import experience tailored to Jira workflows makes Office Timeline more appealing and accessible to Jira-centric teams, expanding our market reach.
2. Increase Conversion to Expert Plan (Access to Jira Import)
Outcome:
The value of Jira integration is now clearer and easier to experience, encouraging trial users to upgrade for access to premium capabilities like filtering, mapping, and timeline generation.
3. Increase Retention for Corporate Accounts
Outcome:
Seamless syncing with Jira allows teams to maintain always-up-to-date visuals, reducing friction and increasing the long-term utility of Office Timeline for enterprise collaboration.
4. Improve User Adoption of Data Imports
Outcome:
Clear workflows, help tips, and a more forgiving setup lower the barrier to entry, driving higher adoption of the import feature—especially among non-technical users.
5. Reduce Redundant Manual Data Entry, Errors, and Enhance Data Consistency
Outcome:
Direct data mapping and field detection eliminate manual copy-paste workflows, improving accuracy and ensuring alignment with source data in Jira.
6. Save Time by Automating the Transformation of Jira Data into Visual Timelines
Outcome:
Task-to-timeline automation drastically cuts down on the time spent building visuals, helping users move faster from data to presentation-ready outputs.